|
Part 2 and Part 3 are online. Introduction
In a recent article we assessed the US cancer program by analyzing the overall incidence and mortality rates of all cancers combined.1 This article uses the same framework of analysis to assess the evolution, over 1975–2007, of 24 specific types of cancer. The analysis is presented in three parts: Part 1 covers 10 cancers from bladder cancer to kidney cancer. Parts 2 and 3, to be published in future issues of this journal, cover the remaining types of cancer in alphabetical order.
With regard to assessing the program of the National Cancer Institute (NCI) in preventing cancer, the criteria used were the incidence rate and the numbers of Americans afflicted by a cancer. A constant or increasing incidence rate over time, along with increased numbers of those afflicted, indicates a failure of the program of the NCI in the prevention of a cancer. If the incidence rate declines, but the number of people afflicted increases, the program is deemed to be a failure. A declining incidence rate, along with a declining number of those diagnosed with the cancer, indicates success in the prevention of that cancer.
With regard to assessing the treatment side of the NCI program, the criteria used were the mortality rate and the numbers of Americans who died from a cancer. A constant or increasing mortality rate of a cancer over time, along with increased number of deaths, indicates a failure of the NCI in the treatment of that cancer. If the mortality rate declines over time but the number of deaths increases, then the program for the treatment side is shown to be a failure. If the mortality rate declines over time and the number of deaths decline, this indicates success in the treatment of a cancer.
The incidence and mortality rates are also available for males and females, as well as age groups within a gender. The more detailed analysis of males and females, and/or age groups helps provide more insight into the causes and treatment of cancers, which could be topics of future research by the authors.
The assessment based on a long time period, such as 1975–2007, provides results that are more comprehensive and thus, more reliable than those based on a shorter time period as seen in other studies.
Data
The data were primarily obtained from the SEER-9 (Surveillance Epidemiology and End Results) database of NCI.2 The data on incidence and mortality rates are primarily for invasive types of cancer; in some cases, data are available for in situ cancers.
Analysis
The 10 cancers analyzed in Part 1 are: Urinary bladder, brain, female breast cancer in situ, female breast cancer invasive, cervix, colon, corpus and uterus, esophagus, Hodgkin's lymphoma, and kidney and renal pelvis.
Due to the massive amount of data involved in such a detailed analysis, we decided to present the statistics in chart form. For each cancer during the analysis period (1975–2007), we calculate two or more of the following charts: (1) the incidence rate – to include overall rates, and rates for males and females, or different age groups within a gender, when relevant; (2) the number of Americans afflicted with the cancer; (3) The mortality rate – to include overall rates, and rates for males and females, or age groups within a gender, when relevant; and (4) the number of Americans who died from that cancer.
Cancer of the Urinary Bladder (Invasive and In Situ)
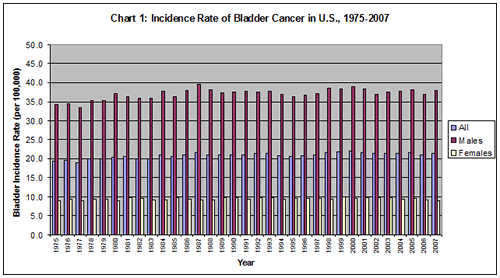
Over the period from 1975 to 2007, the overall incidence rate of urinary bladder cancer grew from 19.3 in 1975 to 21.3 in 2007 (Chart 1). Also, the incidence rates of the males were much higher than those of the females. In 1975, the rate of males was 34.4, while that of females was 8.9. In 2007, the rate for the males increased to 37.8 while that of the females remained at 8.9.
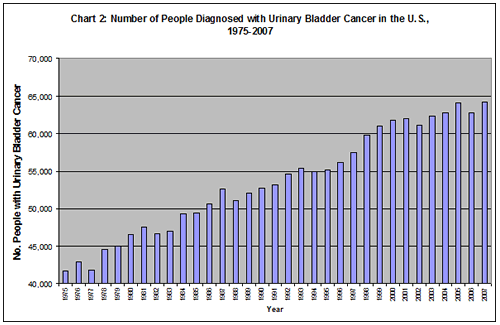
The number of Americans afflicted by urinary bladder cancer annually during the analysis period is calculated by taking the incidence rate and multiplying it with the population of the country (per 100,000).
The number of Americans afflicted with this cancer increased markedly from 41,726 in 1975 to 64,205 in 2007 (Chart 2). The number of Americans diagnosed with this cancer, over 1975–2007, totaled an astounding 1.8 million.
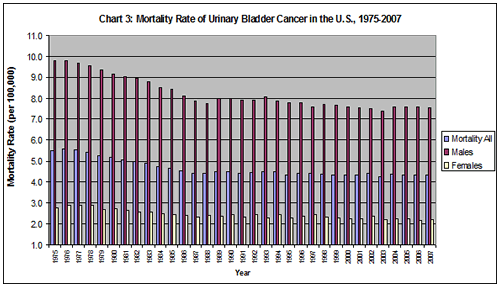
The overall mortality rate decreased from 5.5 in 1975 to 4.4 in 1987 (Chart 3). However, after 1987 the overall mortality rate remained essentially unchanged up to 2007 (4.4). Thus, after 1987, there was not been progress in the treatment of urinary bladder cancer.
When comparing the genders, the males had a higher mortality rate, at 9.8 in 1975, while that of the females was 2.8. By 2007, the rate of the males dropped to 7.6 while that of the females was 2. In 2007, the mortality rate of the males remained significantly higher than that of the females.
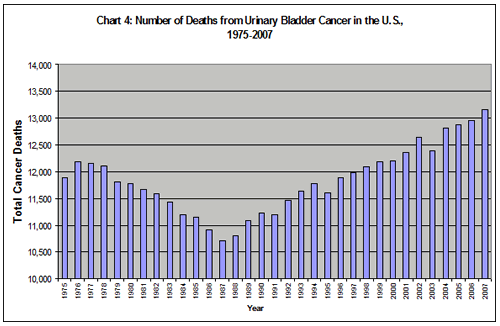
The number of Americans who died annually from bladder cancer declined from 11,879 in 1975 to 10,708 in 1987 (Chart 4). However, after 1987 the number rose steadily and in 2007, reached 13,155, a higher number than in 1975. Therefore, from 1987 to 2007, the treatment side of bladder cancer has been a failure. This is especially the case for the males. From 1975 to 2007, the total number of Americans who died from bladder cancer was 390,871, while the number of people diagnosed with that cancer was 1.8 million. The ratio between the two numbers indicates that on the average, 22% of those diagnosed with bladder cancer will die from it.
Brain Cancer (Invasive)
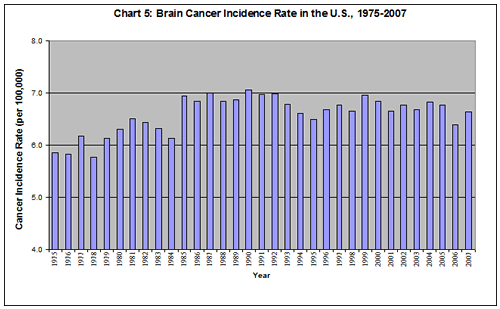
The overall incidence rate of brain cancer increased from 5.9 in 1975 to 6.6 in 2007 (Chart 5). That rate is 12% higher than in 1975.
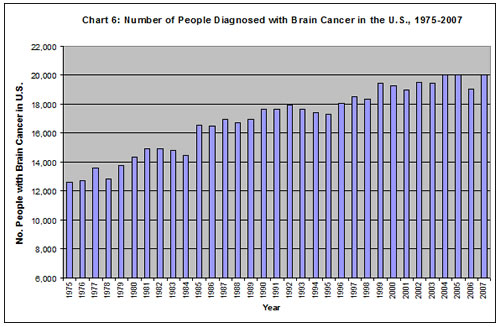
Also, the number of people afflicted by brain cancer surged from 12,634 in 1975 to 20,004 in 2007 (Chart 6). From 1975 to 2007, the number of Americans afflicted with this cancer was a marked 558,716.
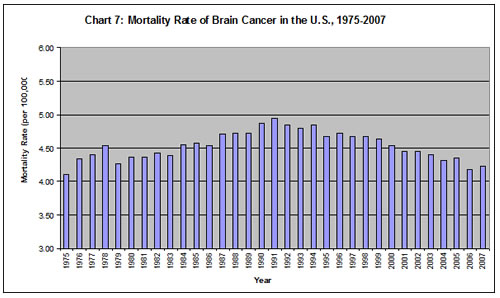
The mortality rate of brain cancer grew from 4.1 in 1975 to 4.95 in 1991 (Chart 7). It then declined, but in 2007 (4.2) was still higher than in 1975.
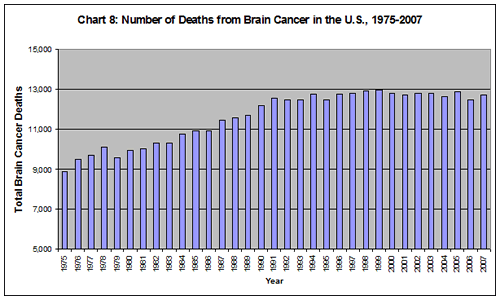
The number of Americans who lost their lives to brain cancer was 8876 in 1975, and this number rose significantly to 12,732 in 2007 (Chart 8). The total number of Americans who died from this cancer was 383,5690. The ratio between those who died to those who were diagnosed indicates that on average 60% of the people who get brain cancer will die from it – a dismal outcome.
Cancer of the Female Breast
SEER provides statistics for two types of female breast cancer: in situ and invasive. Invasive cancer is defined as cancer that has spread beyond the layer of tissue in which it developed and is growing into surrounding, healthy tissues. In situ cancer is early cancer that is present only in the layer of cells in which it began. Some cancers like mesothelioma, leukemia, and lymphoma are not specified as "invasive" because they are by nature invasive (per communication with SEER staff).
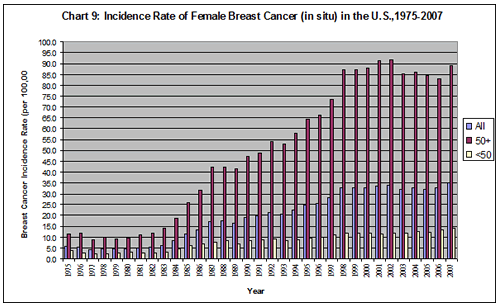
Chart 9 denotes a very bad picture for in situ breast cancer. The overall incidence rate in 1975 was 5.8, and this rate climbed sharply, so that in 2007 it had reached 34.8. The rate of this cancer soared 500% over the analysis period, a phenomenal rate of increase.
In addition, the incidence rate of the "50-plus" group was 11 in 1975, exceeding by far the rate of the "under-50" at 4. Subsequently, the incidence rate of the older group jumped dramatically and reached 89 in 2007, as compared with 14 for the younger group. The incidence rates of both groups in 2007 were significantly higher than in 1975, but more astounding was the 709% incredible growth observed for the 50-plus age group. A successful program in preventing breast cancer in situ would have resulted in decreasing heights of bars from 1975 on.
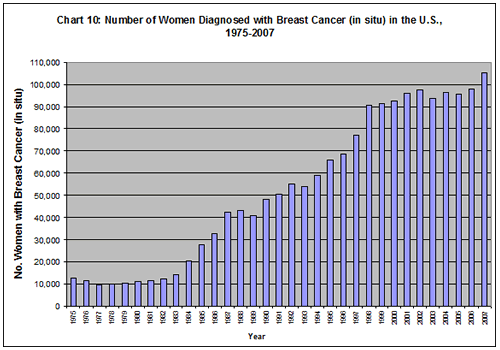
In 1975, the number of women diagnosed with in situ breast cancer was 12,591, while in 2007 an immensely higher number of women, 105,057, received the unpleasant diagnosis (Chart 10). During this period, the total number of women getting this cancer reached a stunning 1.7 million. Statistics for mortality rates for this disease are not available. Per private communication with SEER staff, we were informed that this cancer is rarely deadly.
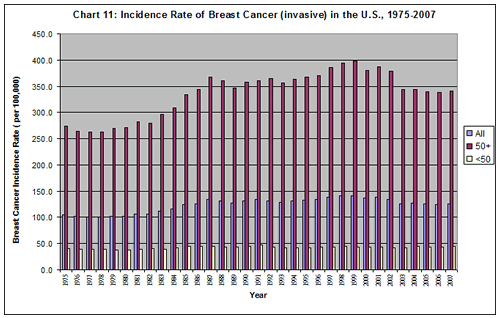
With regard to invasive breast cancer, the overall incidence rate of that cancer rose substantially from 105 in 1975 to 126 in 2007 (Chart 11). In 1975, the rate of the 50-plus age group was a shocking 274, while that of the under-50 age group was 41. This remarkable difference between the two age groups continued to enlarge throughout the analysis period. In 2007, the incidence rate for the 50-plus group reached 341, while the rate for the younger group remained in the 40s.
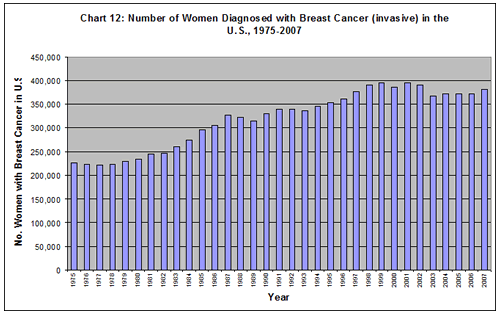
The number of women afflicted by invasive breast cancer also grew significantly. In 1975, the number of women diagnosed with that cancer was 226,923 (Chart 12). This number climbed steadily over time and reached 381,125 in 2007. The total number of women diagnosed with the cancer between 1975 and 2007 was an astounding 10.6 million.
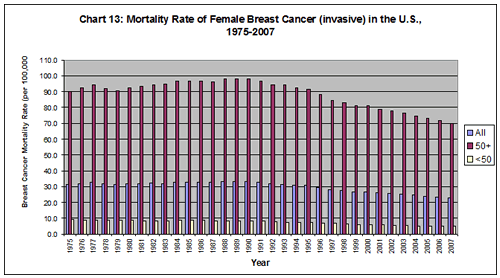
With regard to mortality of invasive breast cancer, the overall mortality rate increased from 31.5 in 1975 to 33.2 in 1990 (Chart 13). Subsequently, the rate decreased to 22.8 in 2007. With regard to age, the 50-plus age group had an incredibly higher mortality rate throughout the analysis period as compared with the under-50 age group. In 1975, the rate of the older women was 90, while the rate of the younger women was 9 (rounded). By 2007, the mortality rate of both groups had declined, but the difference between them had remained significantly large: 70 for the older group vs. 5 for the younger group.
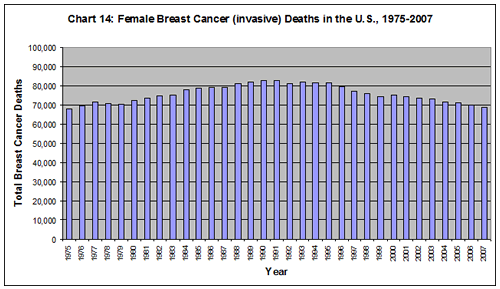
In 1975, there were 67,924 deaths from this cancer, and by 2007 the number had reached 68,911 deaths (Chart 14). This means that the decline in the mortality rate was not large enough to offset increases in the population. The total number of women who died from this disease from 1975 to 2007 was a shocking 2.5 million.
Cancer of the Cervix Uteri (Invasive)
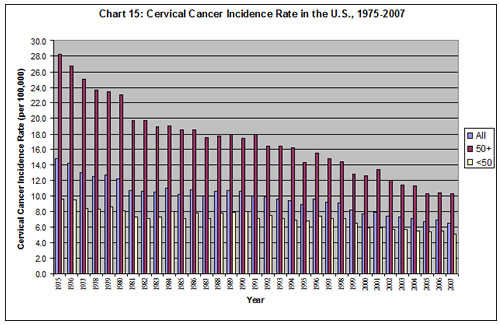
The overall incidence rate of cervical cancer decreased over time, from 14.8 in 1975 to 6.6 in 2007 (Chart 15). In comparing age groups, there is a much higher rate of cervical cancer in the older women. In 1975, the rate for the 50-plus age group was 28.2, while that of the under-50 group was 9.7. In 2007, the incidence rate of the older women was 10.3, which was twice as high as that of the younger women at 5.1. This is still a significant difference between the two age groups.
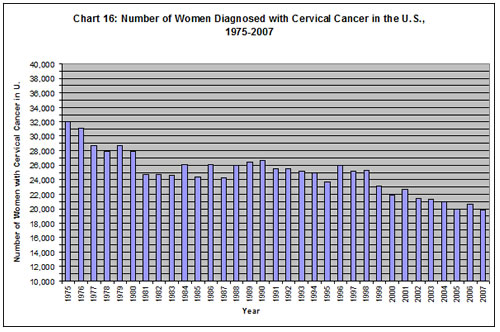
The annual number of women diagnosed with cervical cancer was 31,942 in 1975, and in 2007, the number had dropped to 19,762 (Chart 16). The number of women diagnosed with the cancer during the analysis period totaled a marked 822,926.
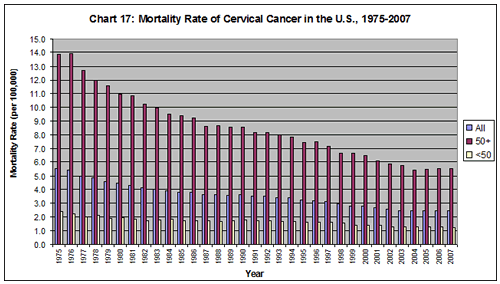
The overall mortality rate of cervical cancer decreased from 5.6 in 1975 to 2.7 in 2007 (Chart 17). With regard to age, in 1975, the mortality rate of the 50-plus age group was 14 as compared with that of the under-50 group, which was 2. In 2007, the older group's rate was 5.6 while the younger group's rate was 1. The difference between the two age groups remained significantly large throughout the analysis period.
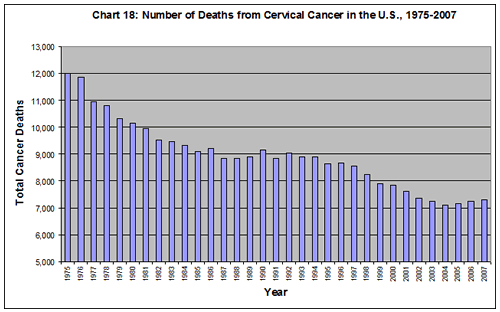
There were 11,987 deaths in 1975 as compared with 7301 deaths in 2007 from cervical cancer (Chart 18). The total number of deaths during the analysis period was 294,745. This indicates that, on the average, 36% of the women diagnosed with cervical cancer will die from it.
Cancer of the Colon and Rectum (Invasive)
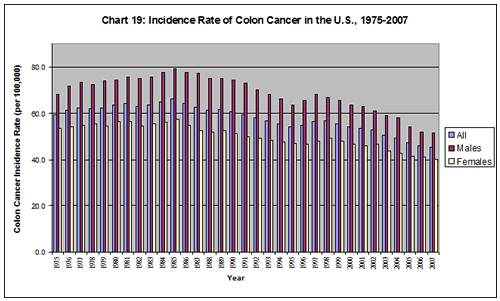
The overall incidence rate of colon cancer declined by 33% over the period of analysis (Chart 19). When comparing genders, the incidence rate of men in 1975 was 68, considerably higher than that of the women, at 54. By 2007, the rate for the men had dropped to 52 and the rate for the women was 40. Although both groups showed decreases in their incidence rates, the gap between the genders remained significant.
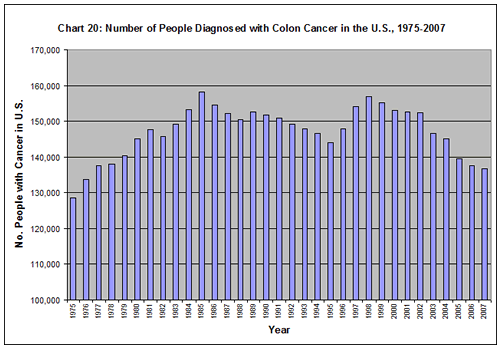
The number of people diagnosed with colon cancer in 1975 was 128,547, and in 2007, the number reached 136,616, still higher than the number in 1975 (Chart 20). During the analysis period, a total of 4.8 million Americans had contracted colon cancer. This is a stunning statistic.
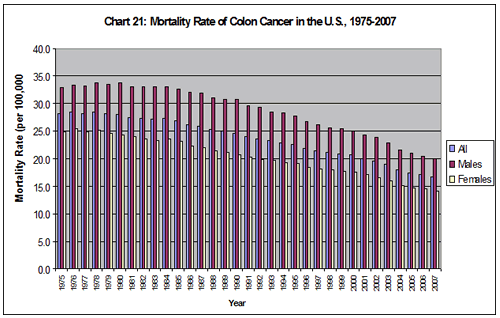
The overall mortality rate of colon cancer decreased by 39% over the course of 1975–2007 (Chart 21). Also, the mortality rate for the males was higher than that of the females throughout the period of analysis. In 1975, the rate for the males was 33 vs. 25 for the females; by 2007, the rate for the males had dropped to 20 while that of the females was 14.
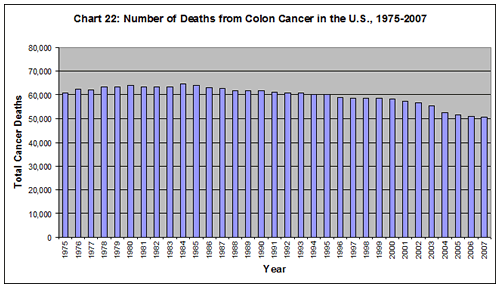
The annual number of deaths from colon cancer decreased from 60,667 in 1975 to 50,447 in 2007 (Chart 22). However, the total number of deaths from this cancer during the period of analysis was 1.9 million. This indicates that of the Americans diagnosed with colon cancer 41% will die from it on the average.
Cancer of the Corpus and Uterus (Invasive)
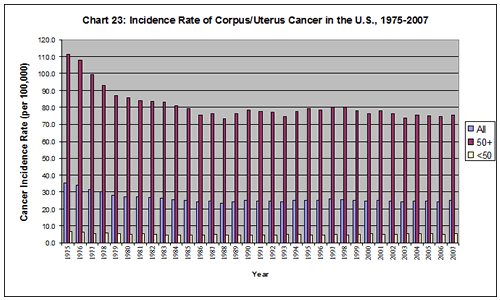
Data on corpus/uterine cancer, in Chart 23, show a 30% decline in the overall incidence rate over the period of analysis. In 1975, the incidence rate for the older age group was an incredible 111; this rate was almost 20 times more than the rate of the younger group, which was 6.5. The rate of the older group declined to 75 in 2007, while the rate of the younger group reached 5.8.
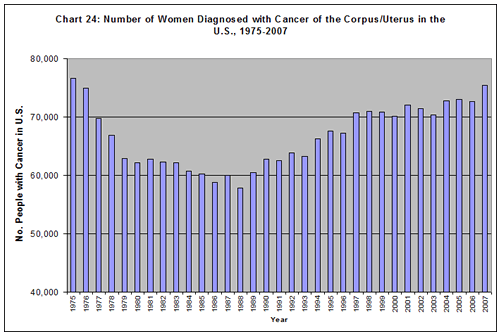
In 1975, the number of women afflicted with this cancer was 76,606, and this number declined until 1988; after that year, it rose, reaching 75,398 in 2007 (Chart 24). This number was close to the 1975 number. The total number of women diagnosed with corpus/uterine cancer during the analysis period was a stunning 2.2 million.
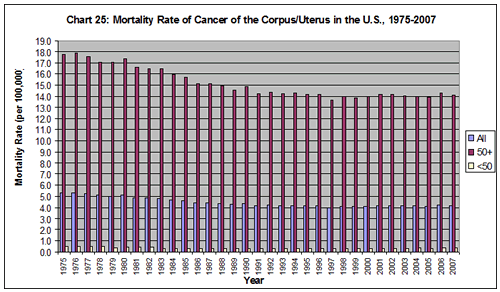
The overall mortality rate of this cancer declined by 21% over the course of the period (Chart 25). Also, the mortality rate in 1975 of the 50-plus age group was substantially higher (at 18) than that of the under-50 age group (at 0.5). The rate of the older group declined to 14 by 2007, while that of the younger group was 0.4. The difference between the two age groups remained significant.
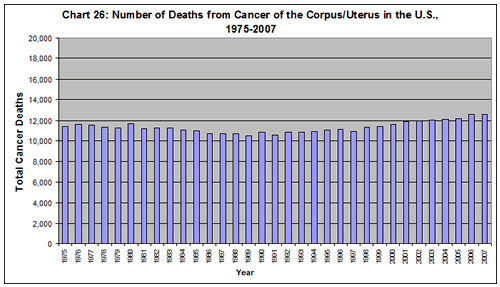
In 1975, the total number of women who lost their lives to corpus/uterine cancer was 11,403; this number grew to 12,612 in 2007 (Chart 26). The total number of deaths from this cancer during the analysis period was 373,943.
Cancer of the Esophagus (Invasive)
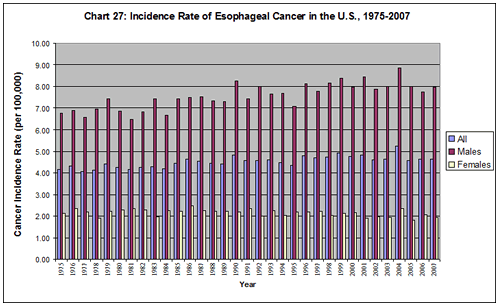
The overall incidence rate of esophageal cancer increased over time, from 4.1 in 1975 to 4.6 in 2007 (Chart 27). A negative characteristic of this cancer is that in 1975, the incidence rate of males (at 6.8) was much higher than that of the females (at 2.1). In 2007, the rate of the males rose to 8.0, while it stayed around 2 for the females. Consequently, the condition of the males worsened over the period of analysis.
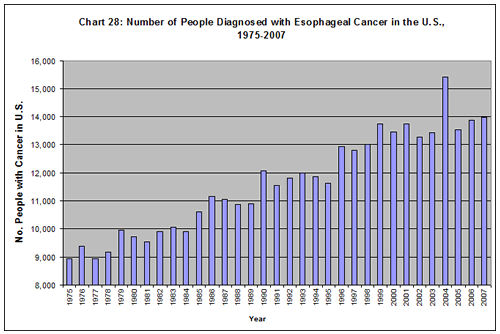
The number of Americans afflicted with esophageal cancer also increased significantly over time. In 1975, 8,941 Americans were diagnosed with this cancer and in 2007, the number had climbed to 13,969 (Chart 28). A total of 384,137 Americans were diagnosed with this cancer during the period of analysis.
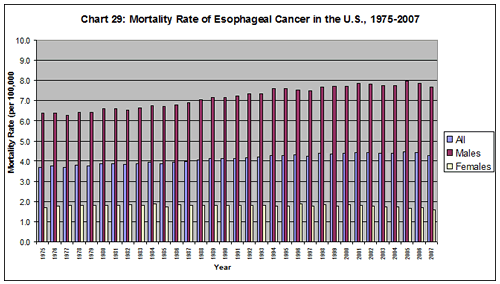
The overall mortality rate of esophageal cancers rose over time from 3.7 in 1975 to 4.3 in 2007 (Chart 29). Also, the mortality rate of the males was 6.4 in 1975, exceeding significantly that of the females, at 1.7. Moreover, the situation for males worsened over time, so that by 2007, their mortality rate had increased to 7.7 while that of the females was 1.6.
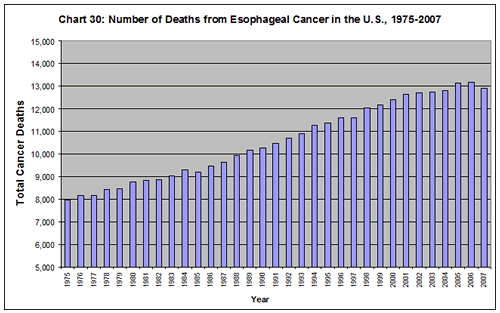
The number of Americans who lost their lives to cancer of the esophagus increased significantly from 7969 in 1975 to 12,883 in 2007 (Chart 30). The total number of deaths from this cancer during the period of analysis was 349,176. This indicates that on average, 91% of Americans diagnosed with esophageal cancer will die from it – a dismal statistic indeed.
Hodgkin's Lymphoma
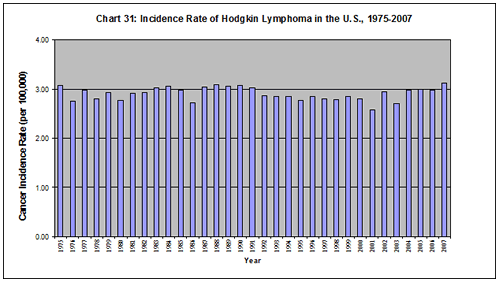
The overall incidence rate of Hodgkin's lymphoma was 3.08 in 1975, and it reached 3.13 in 2007 (Chart 31). That rate remained essentially unchanged over time.
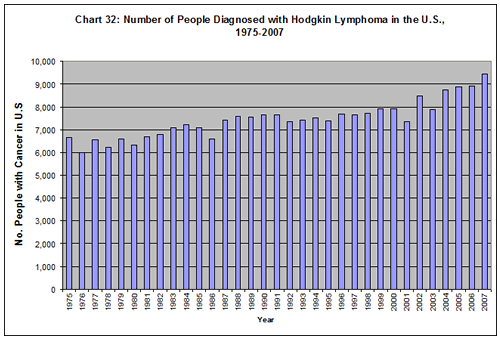
The numbers of Americans afflicted with this cancer rose during the analysis period, as seen in Chart 32. In 1975, 6652 people were diagnosed with Hodgkin's lymphoma, and by 2007 the number had risen to 9444. The total number of people diagnosed with Hodgkin's lymphoma during the analysis period was 245,975.
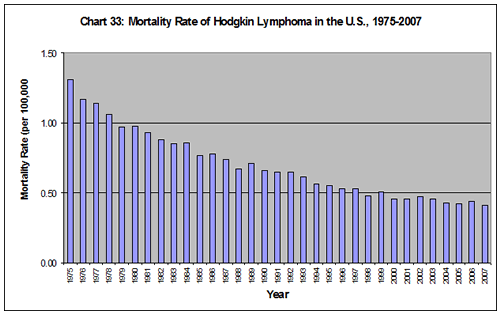
The overall mortality rate of Hodgkin's lymphoma declined rather steadily over time, from 1.3 in 1975 to 0.4 in 2007 (Chart 33). This indicates some success in the treatment side.
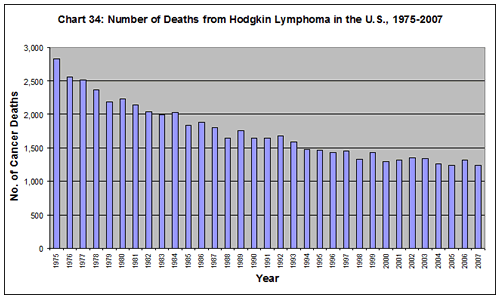
The number of annual deaths from Hodgkin's lymphoma declined from 2829 in 1975 to 1237 in 2007 (Chart 34). The total number of Americans who lost their lives to Hodgkin's lymphoma during the analysis period was 57,260.
Cancer of the Kidney and Renal Pelvis (Invasive)
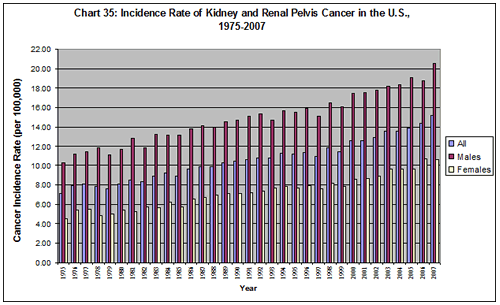
The overall incidence rate of kidney cancer increased steadily over the analysis period, as seen in Chart 35. It more than doubled from 7 in 1975 to 15 in 2007.
Both males and females experienced marked increases in their incidence rates over 1975–2007. Also, the males had a significantly higher incidence rate in 1975, at 10.3, while the rate for the females was 4.5. By 2007, the incidence rate of both groups had doubled, with the rate of the males at 20.6 and that of the females at 10.7.
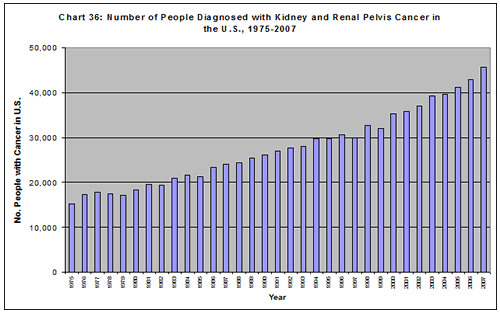
There was a big increase in the number of Americans diagnosed with kidney cancer over the analysis period (Chart 36). This number tripled from 15,291 in 1975 to 45,800 in 2007. The total number of Americans diagnosed with the cancer from 1975 to 2007 was a remarkable 914,172.
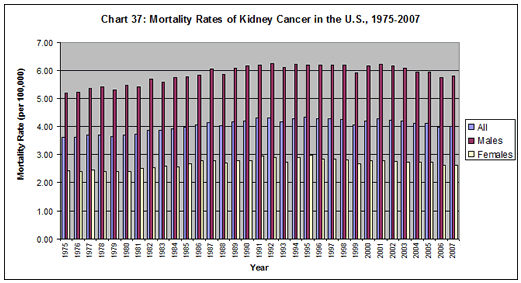
There was a rise over time in the overall mortality rates of kidney cancer (Chart 37). In 1975, the rate was 3.6; by 2007, it had risen to 4. Also, the mortality rate of the males was substantially higher than that of the females. In 1975, the rate for the males was 5.2, while that of the females was 2.4. In 2007, the rate of the males had increased to 5.8, while that of the females was 2.6. The mortality rate of the males rose faster than that of the females, making their situation worse.
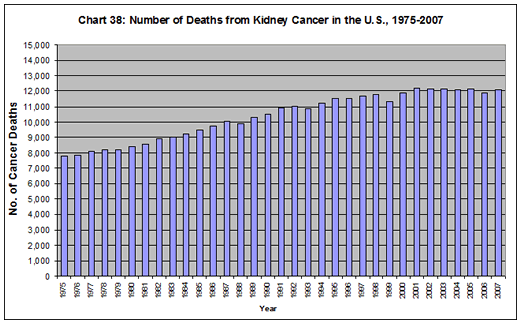
The number of Americans who lost their lives to kidney cancer rose significantly over time, from 7797 in 1975 to 12,069 in 2007 (Chart 38). The total number of Americans who died from this cancer during the analysis period was 342,597. This indicates that, on average, 38% of those diagnosed with kidney cancer will die from it.
Conclusions
In Part 1, we examined incidence rates and the number of people afflicted from 10 specific cancers over 1975–2007, to assess the failure or success of the NCI cancer program in their prevention. We also used available mortality rates and the number of deaths from those 10 cancers over 1975–2007 to evaluate the NCI cancer program's failure or success in their treatment.
Prevention
The evaluation found a failing US cancer program in the prevention of 7 out of 10 cancers studied in Part 1. These 7 cancers showed increasing incidence rates and increasing numbers of those afflicted during 1975–2007: (1) urinary bladder cancer; (2) brain cancer; (3) female breast cancer, in situ; (4) female breast, invasive; (5) cancer of the esophagus; (6) Hodgkin's lymphoma; and (7) kidney cancer.
Also indicating a failing program in the prevention side, 2 of the 10 cancers showed declining incidence rates, but increasing numbers of those afflicted during 1975–2007: (1) colon cancer; and (2) corpus/uterus cancer.
Only 1 of the 10 cancers, cervical cancer, had declining incidence rates and declining numbers of those afflicted during 1975–2007, showing success in the prevention side.
There are other disturbing features on the prevention side of the US/NCI cancer program. For cancers that affect the genders, the incidence rates and mortality rates of males are typically much higher than for females – and they increase faster over time. Specifically, males had higher incidence rates in urinary bladder cancer, esophageal cancer, and kidney cancer.
Also, with regard to age groups, higher incidence rates were observed for older women as compared to younger women in all the female cancers studied: Female breast cancer in situ, invasive breast cancer, corpus/uterine cancer, and cervical cancer.
Treatment
Our study also found a failing US/NCI program in the treatment of 6 out of 9 cancers (there are no mortality data for in situ breast cancer), as indicated by rising or constant mortality rates and rising numbers of deaths; or declining mortality rates but rising numbers of deaths. These cancers are: bladder, brain, female breast invasive, corpus/uterus, esophagus, and kidney.
Also, 3 out of 9 cancers showed decreasing mortality rates and declining numbers of deaths (cervical, colon, and Hodgkin's lymphoma), indicating that the treatment program for these cancers had success.
Also, mortality rates of males were greater than those of the females for the following cancers: urinary bladder cancer, esophageal cancer, and kidney cancer.
Age Groups
The question arises as to why the older age group typically had a much higher incidence rate or mortality rate than the younger age group, and usually these rates increased rapidly over time. One reason might be the compounding effect over a longer time span of environmental carcinogens on the older age group than the younger age group.
Consequently, they are much more likely to contract cancer as their immune systems have been weakened by the attacks of the carcinogens. The carcinogens include chemicals of various types (including pesticides, etc.) and radiation, such as medical radiation (X-rays, CT scans) and releases from nuclear power plants and other nuclear facilities. The link between low-dose radiation and cancer has been described by a number of studies – including a recent study by the National Research Council, on health risks from exposure to low levels of ionizing radiation (2006), and by Dr. J. Gofman (1981). This area will be a topic for future research.
The implication of this is that it is of paramount importance to prevent the occurrence of cancer – particularly in the older age group. However, as the analysis has shown, the program of NCI in cancer prevention has been a dismal failure.
Genders
Another question arose as to why the incidence and mortality rates of men were consistently much higher than those of women. This indicates that the NCI program has been a dismal failure in the prevention and treatment of cancer for men.
Final Thoughts
Part 1 showed increasing incidence rates of the majority of the 10 cancers studied over 1975–2007. This resulted in a shocking 24 million Americans diagnosed with cancer – an amazing phenomenon after 33 years of NCI's leadership to eliminate cancer. Also, the mortality rates of several of these cancers rose during this period, resulting in 6.6 million Americans suffering and losing their lives prematurely to cancer, and subsequently affecting their families in a devastating manner.
Why has the NCI program failed those millions of American people in the prevention and treatment of cancer? The answer involves economics and politics. First, the prevention program has intense points of friction. When the NCI (or Environmental Protection Agency, etc.) discovers a product to be carcinogenic and takes steps to remove it from the market, there ensues much friction. This comes primarily from the different industries whose sales and profits will be affected. Therefore, they fight the proposal and typically win the battle. In addition, the treatment side of cancer greatly benefits the health-care industry as pharmaceutical companies pump out increasing number of drugs to treat the ever-growing number of Americans afflicted by these cancers. Over 1975–2007, 24 million taxpayers were diagnosed with one of these 10 cancers, and 6.6 million, who were hopeful for a cure, unwittingly lost their lives to these cancers during this time period.
The toxic relationship between the government and corporations has been described extensively in the literature, including a book titled Toxic Deception – How the Chemical Industry Manipulates Science, Bends the Law and Endangers Your Health (Fagin and Lavelle 1999), and another titled Deceit and Denial (Markowitz and Rosner 2003). Similar activities have been described for the atomic power industry in studies like The Menace of Atomic Energy (Nader and Abbotts 1977). Thus, regulations are not implemented to remove carcinogens from the environment – or, in other words, to ensure the health and safety of the American people – but are manipulated to ensure profits of corporations. The end result is that increasing numbers of Americans are becoming victims to cancer.
Failures on both the prevention and treatment sides are the result of the failed NCI program over 33 years. These failures call for a basic restructuring and reorientation of the US program to prevent and cure cancer.

Part 2 and Part 3 are online.
Notes
1. Apostolides AD, Apostolides IK. The US Cancer Program, 1975–2006: A Failure. Townsend Lett. Aug/Sept 2010; Part 1; October 2010; Part 2.
2. SEER-9 provides data from nine geographic areas: Connecticut, Hawaii, Iowa, Utah, New Mexico, Detroit, Atlanta, Seattle, and San Francisco. This geographic group constitutes approximately 10% of the US population. The US cancer mortality data are obtained by NCI from the Centers for Disease Control and Prevention (CDC) and are incorporated into the SEER database. SEER provides both incidence and mortality rates of cancers in age-adjusted form and expressed in terms of 100,000 population. The incidence rates are also adjusted by SEER for delays in the reporting of cancer cases. These adjustments were described and discussed in our previous article in the Townsend Letter (Aug/Sept 2010; October 2010).
References
Begley S. We fought cancer ... and cancer won. Newsweek. September 6, 2008.
Epstein SS. The politics of cancer revisited. Freemont Center, NY: East Ridge Press; 1998.
Fagin D, Lavelle M, Center for Public Integrity. Toxic Deception – How the Chemical Industry Manipulates Science, Bends the Law and Endangers Your Health. Monroe, ME: Common Courage Press; 1999.
Faquet GB. The War on Cancer: An Anatomy of Failure, A Blueprint for the Future. Dordrecht, Netherlands: Springer; 2005.
Gofman, J.W. Radiation and Human Health: A Comprehensive Investigation of the Evidence Relating Low-Level Radiation to Cancer and Other Diseases. San Francisco: Sierra Club Books; 1981.
Markowitz G, Rosner D. Deceit and Denial – The Deadly Politics of Industrial Pollution. Berkeley, CA: University of California Press; 2003.
Nader R, Abbotts J. The Menace of Atomic Energy. New York: W. W. Norton and Co.; 1977.
National Research Council, Board of Radiation Effects Research. Health Risks from Exposure to Low Levels of Ionizing Radiation – BEIR VII PHASE 2. Washington, D.C.: National Academies Press; 2006.
SEER-9 (Surveillance Epidemiology and End Results). Cancer statistics review 1975–2007 [online document]. Available at: www.seer.cancer.gov/statistics.
United States Bureau of the Census. Population. In: Statistical Abstract of the United States.
Anthony D. Apostolides, PhD, has engaged in research and teaching on health-care economics and other areas of public-sector economics. He taught in universities/colleges, worked for the federal and state governments (Maryland Department of Health), and has published articles in peer-reviewed journals. He has also worked for the United Nations and The Conference Board. He received a doctoral degree in economics from the University of Oxford, UK, and a master's degree from the University of Pittsburgh.
Ipatia K. Apostolides, BA, has more than 15 years of experience in the cancer field (Cleveland Clinic Foundation, and Children's Hospital, Cincinnati) and has coauthored several medical articles related to cancer. She was supervisor in the PLCO study at Georgetown University. She has a bachelor's degree in biology from Case Western Reserve University and several years of postgraduate work.
To contact the authors: article@pattyapostolides.com
|