|
Part One is also online.
Probability of Americans Getting Cancer
The third statistic examined in this study is the probability of an American getting cancer in his or her lifetime. These numbers are shown in Table 3. Each probability relates to a 3-year period and includes separate data for males and females. The probabilities are calculated from data provided on the website of the Surveillance, Epidemiology, and End Results (SEER) Program of the National Cancer Institute (NCI).
Table 3: Lifetime Probabilities of Developing Cancer in the US
All In Situ and Malignant Sites, All Races
|
|
|
Year |
Male |
Female |
|
|
|
1975–1977 |
33.4 |
33.9 |
1978–1980 |
35.7 |
34.3 |
1981–1983 |
37.8 |
35.8 |
1984–1986 |
39.6 |
38.2 |
1987–1989 |
42.7 |
39.7 |
1990–1992 |
49.6 |
41.1 |
1993–1995 |
47.0 |
40.8 |
1996–1998 |
46.8 |
42.8 |
1999–2001 |
48.5 |
42.9 |
2002–2004 |
47.4 |
42.2 |
2004–2006 |
46.3 |
41.5 |
|
|
|
Source: "SEER-9 Incidence and Mortality, 1975–2006."
Database from SEER website: http://seer.cancer.gov.
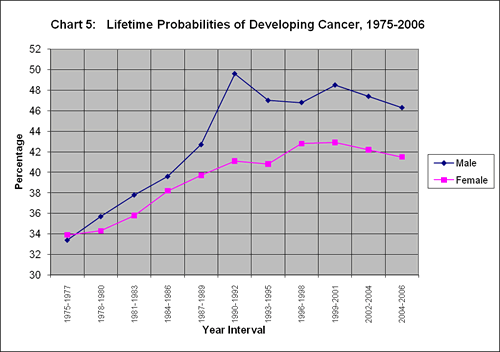
In examining these numbers, we were astonished to find that these probabilities were already high at the beginning of the analysis period. During 1975–1977, the probability of a man getting cancer during his lifetime was more than 33%. That meant that 1 in 3 males would get cancer – already a bad situation. However, despite the NCI program, the probability for an American male of getting cancer climbed to a shocking 50% during the 1990–1992 period. This led to the grim expectation for US males that half of them would get cancer during their lifetimes. Since 1990, the probability of getting cancer for an American male has hovered in the range of 46% to 50%.
With respect to women, the situation is also dismal. During 1975–1977, a woman in the US had a 34% probability of getting cancer in her lifetime, and by 2004–2006, that probability had increased to 42%. That means that 42 out of 100 women would get cancer – very close to 1 out of 2.
In Chart 5, one observes the rise in probabilities for both men and women of getting cancer in their lifetimes. For men, the highest probability is shown during 1990–1992. Subsequently, the probability declined to a degree, but it was still much higher than in 1975–1977. For women, the probability continued to rise over time, reaching its highest point in 1999–2001. In the most recent 2004–2006 period, American men and women were much more likely to get cancer in their lifetimes than was the case in 1975–1977.
Short-Term vs. Long-Term Cancer Statistics
Public announcements are typically made by government agencies and presented in the news media, by usingcancer statistics that cover only a short period – for example, 2 to 3 years. In such cases, the public can easily be misled, since a short time period conceals the more comprehensive, long-term picture of the disease. This applies especially when there is a decrease in cancer statistics.
The cancer data presented in this study span 1975 through 2006, a period of 32 years. This period results in a long-term assessment, which provides a more accurate and reliable evaluation of the cancer program than one based on only a few years of data. When data of a few years are used, they should be presented within a long-term framework, in order to provide a valid assessment of the true cancer situation.
If the NCI were to announce that the cancer incidence rate declined from 1992 to 1993, that would be technically correct, but it would not provide the accurate long-term picture. If there was not also a statement of the incidence rate from 1975 until 1993, there would be an incomplete, inaccurate, and misleading picture provided to the public of the cancer incidence. To the average person, the isolated data for 1992 and 1993 would indicate an improvement (decline) in the cancer incidence rate. However, that would indeed be a very incorrect interpretation because, as we have shown in this study, the long-term, accurate picture shows an increased incidence rate.
The same consideration applies to public announcements on mortality rates from cancer. Any short-term statistics – particularly when they indicate an improvement in the cancer mortality rate – need to be placed in a framework that covers a long number of years.
Implications of Increasing Cancer Incidence and Mortality
If the cancer prevention program of the US had been effective, one would expect a significant reduction in the cancer incidence rate since 1975. In actuality, there have been increases in that rate over time. And this resulted in a steady and continuous rise in the total number of Americans getting cancer. Therefore, the program of the NCI toward cancer prevention has been a failure; and Americans have been, and are, paying a heavy price for this failure – as more and more are afflicted by cancer.
The cancer mortality relates to the effectiveness – or ineffectiveness – of treatments. An increasing mortality rate shows a lack of effectiveness in cancer treatment. That rate increased from 1975 to 2000; it did not decrease nor did it even stay the same as in 1975. The decrease in that rate from 2000 to 2006 translates into a virtually zero decrease, annually, over the entire 1975–2006 period. These numbers show a failure of the NCI's program toward the treatment of cancer. [Note: The statistics on cancer are in contrast to the mortality rates from cardiovascular disease and stroke, which fell by 52 and 60%, respectively, from 1975 through 2006 (Spector 2010).]
Also, the decrease in the cancer mortality rate over 2000 to 2006 may well have been affected by the increasing use of alternative or integrative treatments for cancer (Apostolides 1999). People have increasingly become discouraged with and weary of traditional cancer treatments (chemotherapy, etc.), and more would have chosen to use either an integrative approach (combining an alternative approach with conventional treatment) or solely alternative treatments. It would be very useful to have data on the outcomes of such treatments. Unfortunately, that is not possible, due to the intransigence of the NCI and the Food and Drug Administration in allowing/trying alternative therapies.
In a proper framework of providing treatment, cancer patients would be given the choice of approach to pursue – based on currently available information. They could then choose and accept (by signing an informed-consent form) their preferred method of treatment. There could be at least three choices: (1) conventional approaches (surgery, etc.); (2) integrative approaches; and (3) alternative approaches – of which there is a variety. Records would be kept on the outcomes of the three approaches. These data would then enable people to learn which approach provides the best results. It is a sad and incredible fact that presently Americans do not have such a freedom of choice in cancer treatment.
Results of Other Studies
Other studies have found results similar to those of this assessment. A study in the 1980s by two Harvard scientists noted the dismal record of the campaign to eradicate cancer in the US (Bailar and Smith 1986). They pointed out that there is "no evidence that some 35 years of intense and growing efforts to improve the treatment of cancer have had much overall effect on the most fundamental measure of clinical outcome – death." An update of those results showed that the age-adjusted mortality due to cancer in 1994 was 6.0% higher than in 1970 (Bailar and Gornick 1997).
Another assessment of the US cancer program is available in a recent book by G. Faguet, MD (The War on Cancer: An Anatomy of Failure, A Blueprint for the Future; 2005). Faguet states: "The message of this book is that, contrary to recurrent announcements of breakthroughs in the War on Cancer designated to influence policy makers and impress the public, little progress has been made in the treatment of cancer since the enactment of the National Cancer Act of 1971" (p. 1).
Faguet also states: "In conclusion, an objective analysis of cancer chemotherapy outcomes over the last three decades reveals that, despite vast human and financial expenditures, the cell-killing paradigm has failed to achieve its objective, the former rallying phrase War on Cancer has been abandoned by the NCI, and the conquest of cancer remains a distant and elusive goal" (p. 89). He also points out that "… the three crucial measures of progress in the War on Cancer, cure rates, prolongation of survival, and quality of life, remain stagnant despite enactment of the National Cancer Act of 1971" (p. 93).
In addition, an article by Clifton Leaf presents evidence to show "Why We're Losing the War on Cancer" (2004). He evaluates the treatment side of the cancer program led by NCI, noting that, even adjusting for age, the rate of Americans dying from cancer (per 100,000) was about the same in 2002 as it was in 1970 – and in 1950.
Therefore, studies by other researchers have pointed out that the cancer program of the US, guided by NCI, has been a failure.
Conclusions and Recommendations
The findings of our research on the impact of cancer on Americans are grim and shocking. The analysis shows a failed program of NCI with regard to both cancer prevention and treatment. The situation since 1975 has been worsening – with the following dismal outcomes:
- The incidence rate of contracting cancer increased from 1975 to 2006.
- The increased cancer incidence rates, combined with increases in the US population, resulted in many more Americans' getting cancer in 2006 than in 1975.
- Over 1975–2006, the total number of Americans afflicted by cancer has grown faster than the US population.
- With regard to cancer mortality, during each of the 25 years from 1975 to 2000, more Americans per 100,000 died from cancer than in 1975. Also, many more Americans died from cancer in 2006 than in 1975. It is a disturbing fact that the number of Americans who have been losing their lives to cancer in the 1990s and 2000s translates into 63 Americans dying from cancer every hour of the day – or 1 every minute of each hour.
- With respect to the probability of contracting cancer, as of 2004–2006, American males faced a staggering probability of almost 46% of contracting cancer in their lifetimes, while American females were facing a 42% probability of getting cancer in their lifetimes.
- There are a number of shortcomings with the existing cancer data. With respect to one shortcoming, it would seem imperative that cancer statistics (incidence and mortality) be provided to the public by NCI, in both crude and age-adjusted forms. Otherwise, the full picture is not available to the public.
The American people have been paying too high a price – with their lives – for a misguided and ineffective cancer program. A main recommendation for a more effective cancer program is for the NCI to be drastically restructured and its programs to be significantly changed.Changes would include an increased effort at cancer prevention. Equally important, however, is for the findings on prevention to be widely disseminated to the public.
Also, the treatment side of the NCI should be radically revamped, to include much more work on alternative treatments for cancer. This is unlikely to happen with the current structure of the NCI. There are many vested interests there in maintaining the status quo, and a substantial change in its program would indicate acceptance of the fact that its treatment programs did not work. Therefore, another institution would need to be established to undertake only alternative treatments. Perhaps that institution could be the National Center for Complementary and Alternative Medicine; however, the agency should be independent of the NCI.
In carrying out these changes, the NCI budget can be cut in half over a period of several years and the removed funds allocated to support the adoption of alternative treatments. At the end of a number of years (e.g., 10), the outcomes of treatments supported by the two institutions should be compared. Subsequently, the institution whose treatments provide the higher level of successes in treating cancer patients should be expanded; the institution with little success in treating cancer should be made smaller.
Changes such as those will require active involvement by the legislative and executive branches of the federal government. An obstacle to restructuring the cancer program seems to be that those two branches have not been convinced that the traditional program of the NCI is failing to a large enough degree that a new alternative approach needs to be offered to cancer patients.
And finally, the change in the cancer program indeed rests with the citizens of the US. They are the ones with the voting power, and they can change legislators and presidents in order to obtain the changes that they wish. It seems unthinkable that the US, which professes to champion freedom around the world, does not offer that same freedom to its people in their choice of cancer treatment. That is the mark of a totalitarian regime. Consequently, the last hope of a change in cancer prevention and treatment remains on the shoulders of the American people. They need to be informed and convinced of the need for change. Then, they need to organize and act, at the political level, to transform the cancer program.

References
Apostolides AD. Alternative treatments of cancer: trends over time and implications for the future. J Health Soc Policy. 1999;10(3).
Bailar JC III, Smith EM. Progress against cancer? N Engl J Med. May 8 1986;314(19).
Bailar JC III, Gornick HL. Cancer undefeated. N Engl J Med. May 29 1997;336(22).
Clegg LX, Feuer EJ, Midthune DN, Hankey BF. Impact of reporting delay and reporting error on cancer incidence rates and trends. J Natl Cancer Inst. Oct. 16 2002;94(20).
Engel LW, Strauchen JA, Chiazze L Jr, Heid M. Accuracy of death certification in an autopsied population with specific attention to malignant neoplasms and vascular diseases. Am J Epidemiol. 1980;111(1).
Epstein SS. Cancer-Gate: How to Win the Losing Cancer War. Amityville, NY: Baywood Publishing Company; 2005.
Faguet GB. The War on Cancer: An Anatomy of Failure, A Blueprint for the Future. Dordrecht, Netherlands: Springer; 2005.
Horner MJ, Ries LAG, Krapcho M, et al., eds. SEER cancer statistics review, 1975–2006. National Cancer Institute. http://seer.cancer.gov/csr/1975_2006; based on November 2008 SEER data submission, posted 2009.
Kolata G. In long drive to cure cancer, advances have been elusive. New York Times. April 24, 2009.
Landrigan PJ. Commentary: Environmental Disease – A Preventable Epidemic. Am J Public Health. July 1992;82(7).
Leaf C. Why we're losing the war on cancer. Fortune. March 22, 2004.
Percy C, Stanek E III, Gloeckler L. Accuracy of cancer death certificates and its effect on cancer mortality statistics. Am J Public Health. March 1981;71(3).
Spector R. The war on cancer – a progress report for skeptics. Skeptical Inquirer.
January/February 2010.
United States Bureau of the Census. Statistical Abstract of the United States; section on Population.
Appendix A – Shortcomings of Existing Cancer Data
1. The reporting by SEER of only age-adjusted data instead of crude and age-adjusted data; actual cancer mortality rates show a different picture than age-adjusted rates.
The SEER data are made available in age-adjusted form but not in their actual form – referred to as "crude" in official NCI statistics. One needs to do special tabulations on the NCI web site in order to translate the SEER age-adjusted data into the crude data.
Data on cancer mortality rates are available from CDC as both crude and age-adjusted rates. These are presented in Appendix Table A-1 (along with age-adjusted mortality rates from SEER). From 1979 to 2006, the crude rates show an increase annually (0.2%), while the age-adjusted rates show a decrease annually (−0.4%). There is a substantial difference in the information provided by the age-adjusted data and crude data. Consequently, an incomplete picture of cancer is given when only the age-adjusted data are provided by NCI to the public.
Table A-1: Cancer Mortality in the US, 1975–2006: SEER and CDC Data
|
SEER |
|
CDC |
Year |
Age-Adjusted Rate Per 100,000 Population |
|
Crude Rate Per 100,000 Population |
Age-Adjusted Rate Per 100,000 Population |
|
(1) |
|
(2) |
(3) |
|
|
|
|
|
1975 |
199.1 |
|
|
|
1976 |
202.3 |
|
|
|
1977 |
203.0 |
|
|
|
1978 |
204.4 |
|
|
|
1979 |
204.5 |
|
182.2 |
207.0 |
1980 |
207.0 |
|
186.5 |
211.0 |
1981 |
206.4 |
|
186.6 |
209.5 |
1982 |
208.3 |
|
190.0 |
211.5 |
1983 |
209.2 |
|
192.3 |
212.3 |
1984 |
210.9 |
|
194.9 |
213.9 |
1985 |
211.3 |
|
196.7 |
214.4 |
1986 |
211.8 |
|
198.2 |
214.6 |
1987 |
211.9 |
|
199.5 |
214.7 |
1988 |
212.6 |
|
201.0 |
215.5 |
1989 |
214.3 |
|
203.6 |
217.1 |
1990 |
214.9 |
|
205.7 |
219.0 |
1991 |
215.1 |
|
206.1 |
218.2 |
1992 |
213.7 |
|
205.6 |
216.5 |
1993 |
213.4 |
|
206.7 |
216.5 |
1994 |
211.7 |
|
205.8 |
214.7 |
1995 |
209.9 |
|
205.0 |
212.9 |
1996 |
207.0 |
|
203.0 |
209.7 |
1997 |
203.6 |
|
200.6 |
206.3 |
1998 |
200.8 |
|
199.1 |
203.7 |
1999 |
200.7 |
|
201.8 |
205.6 |
2000 |
198.7 |
|
201.3 |
204.5 |
2001 |
195.9 |
|
199.2 |
200.9 |
2002 |
193.7 |
|
197.9 |
198.1 |
2003 |
190.1 |
|
196.2 |
194.4 |
2004 |
185.9 |
|
193.2 |
190.4 |
2005 |
184.2 |
|
193.3 |
188.3 |
2006 |
181.1 |
|
191.7 |
185.3 |
|
|
|
|
|
|
|
|
|
|
Note: The age-adjusted rates use the population of year 2000 as the standard population. |
Sources: The data of SEER are from Table 1.
The data of CDC were obtained at CDC WONDER
(http://wonder.cdc.gov/mortSQL.html). |
2. The age-adjusted mortality rates of SEER are lower than those of CDC.
The age-adjusted cancer mortality rates from CDC are higher than the SEER rates.
3. Mortality statistics are not adjusted by CDC or SEER for possible mistakes.
Cancer mortality statistics are obtained by NCI from CDC and are incorporated into the SEER database. However, the cancer mortality statistics are not revised byCDC. Once these statistics are collected for any year, they stay at that number and are not updated. This can create problems with measurementsinceany pastmistakes that may have been made in the count stay unchanged. Since large data series typically need to be revised and updated over time, we wonder about the quality and reliability of the mortality statistics of CDC used by SEER, that undergo no updating. A number of studies have revealed errors in the accuracy of cancer death certificates and the effect on cancer mortality statistics (Percy et al. 1981, Engel et al. 1980).
4. Implications of age-adjusted cancer rates.
Age-adjusted cancer rates have been adjusted – that is, changed – for the impact of age in cancer incidence or mortality. In doing this adjustment, a particular year is chosen whose population becomes the standard population. This population (by age brackets) is used to multiply the incidence rates, by age brackets, of other years. This holds the population of the county the same in every year of a period of years. Consequently, the age-adjusted incidence (or mortality rate) is calculated as to what it would have been if the population had not changed over time.
The rationale behind the age adjustment is that the cancer incidence will increase in a country if the population is aging (that is, when the older age brackets grow faster than the young age brackets) because older people have higher incidence rates. However, an increased incidence of people in the older age brackets can be the result of two factors. One would be that age results in increased disease – other things, like the environment, being constant. The second factor is the environment which contains carcinogens (which tend to increase over time) and older Americans would have been exposed to these carcinogens over longer periods of time than younger people.In time, they succumb to increased attacks on their immune system by the carcinogens, and cancer occurs.
The age-adjustment holds the age of the population constant but does not hold constant the effect of the environment on people over time. This makes it more relevant for NCI/SEER to provide both crude cancer data and age-adjusted data. This would provide a more complete andaccurate situation ofcancer to the public.
5. Delays in the reporting of cancer incidence counts.
In 2002, research by staff of NCI reported that there were delays in the reporting of cancer cases. These delays resultedinsignificant undercountingof the cancer cases for a particular year. Consequently, the cancer incidence rates, reported by SEER, were underestimates of the actual cancer incidence rates. The study analyzed data for six important types of cancer: female breast, colorectal, lung/bronchus, prostate, and melanoma. According to the study, although the SEER program allows about 2 years for the collection of newly diagnosed cancer cases, it would actually take 4–17 years for 99% or more of the cancer cases to be reported (given the incidence counts initially reported). The incidence counts reported, at the 2-year delay, accounted for just 88–97% of the estimated final incidence counts (Clegg et al. 2002).
The SEER data for cancer incidence available for 1975–2006 have been adjusted for reporting delays. Thus, it is possible to compare incidence rates reported for 1975–2003, which were not adjusted for reporting delays, with more recent incidence rates for 1975–2006, which had been adjusted for reporting delays. These data are presented in Appendix Table A-2. In examining the two sets of numbers, one does not observe substantial differences between them.
Table A-2: Incidence Rates – SEER – 2003 and 2006
Adjustment for Reporting Delays
Year |
Cancer Incidence Rate (age-adjusted) |
Cancer Incidence Rate (age-adjusted) –Adjusted for reporting delays |
|
(1) |
(2) |
|
|
|
1975 |
400.3 |
400.4 |
1976 |
407.2 |
407.4 |
1977 |
407.6 |
407.7 |
1978 |
407.2 |
407.3 |
1979 |
412.4 |
412.5 |
1980 |
417.7 |
417.9 |
1981 |
425.1 |
425.2 |
1982 |
424.3 |
424.5 |
1983 |
430.9 |
431.1 |
1984 |
439.6 |
439.9 |
1985 |
448.4 |
448.7 |
1986 |
451.0 |
451.3 |
1987 |
467.8 |
467.9 |
1988 |
463.5 |
463.7 |
1989 |
467.3 |
467.5 |
1990 |
481.2 |
481.7 |
1991 |
502.3 |
502.7 |
1992 |
509.8 |
510.2 |
1993 |
492.6 |
493.0 |
1994 |
482.5 |
482.9 |
1995 |
475.5 |
476.1 |
1996 |
477.3 |
478.3 |
1997 |
484.3 |
485.5 |
1998 |
485.7 |
486.9 |
1999 |
487.6 |
489.2 |
2000 |
481.9 |
484.0 |
2001 |
483.7 |
486.5 |
2002 |
478.9 |
483.0 |
2003 |
459.6 |
469.3 |
2004 |
|
467.7 |
2005 |
|
459.9 |
2006 |
|
456.2 |
|
|
Note: The data in column 1 are not adjusted for reporting delays, by SEER. |
Sources: Data in column 1 were obtained from
http://seer.cancer.gov/csr/1975_2003/results_merged/ topics_annualrates.pdf. (Editor note: Link changed as of 6/2010. View info at http://seer.cancer.gov/csr/1975_2007/sections.html ) |
For data in column 2, same source as in Table 1. |
Using data provided in the NCI study, we estimated that 7.5% of cancer cases would not be reported, on the average, at the 2-year period. The calculation is shown below. With that magnitude of cases not reported (at the 2-year period), one would have expected the incidence rates after adjustment for reporting delays to be noticeably higher than the ones shown. Nevertheless, these are the numbers provided by SEER, unless there is appraisal in the future of the technique used for the adjustment.
Calculation: (1) (97 + 88)/2 = 92.5% of the cases would be reported, on the
average, at the 2-year period; and (2) 100 − 92.5 = 7.5% of cancer cases
would be missed on the average at the 2-year period.
Correspondence/questions may be sent to the authors at article@pattyapostolides.com.
|