
The US Cancer Program and Specific Types of Cancers, 1975–2007: A Failure
Part 3
by Anthony D. Apostolides, PhD and Ipatia K. Apostolides, BA
article@pattyapostolides.com
Introduction
This is Part 3 of a study that assesses 24 specific types of cancer, over 1975–2007. Part 1 and Part 2 evaluated 17 cancers in alphabetical order from bladder to non-Hodgkin’s lymphoma, published in previous issues of the Townsend Letter.1 Part 3 analyzes the remaining seven cancers: oral cavity and pharynx, ovary, pancreas, prostate, stomach, testis, and thyroid.
Data
The data were primarily obtained from the SEER-9 (Surveillance Epidemiology and End Results) database of the National Cancer Institute (NCI). SEER-9 provides data from nine geographic areas: Connecticut, Hawaii, Iowa, Utah, New Mexico, Detroit, Atlanta, Seattle, and San Francisco. This geographic group constitutes approximately 10% of the US population. The US cancer mortality data are obtained by NCI from the Centers for Disease Control and Prevention (CDC) and are incorporated into the SEER database. Data on the US population were obtained from the US Bureau of the Census, Statistical Abstract of the United States.
SEER provides both incidence and mortality rates of cancers in age-adjusted form (to remove the effects of age on cancer incidence and mortality). Those data are calculated numbers of incidence and mortality by holding constant the age distribution of the US population to that of a given year (presently, the year is 2000). Thus, an incidence rate of 20 for a particular cancer means that 20 people per 100,000 population were expected to have been diagnosed with that cancer if the population of the US was the same as in year 2000. Consequently, an increase in the incidence rate indicates a real increase in cancer cases/cancer impact. 2 The same applies to the mortality rates. The incidence rates are also adjusted by SEER for delays in the reporting of cancer cases.
Analysis
Due to space limitations, this article presents the data in five charts. The complete set of charts is presented in the long version of the article, available online at TownsendLetter.com.3
With regard to assessing the National Cancer InstituteNCI program of the in forventing cancer, the criteria used were the incidence rate and the number of Americans afflicted by a cancer. A constant or increasing incidence rate over time, along with increased numbers of those afflicted, indicates a failure of the NCI program in the prevention of a cancer. If the incidence rate declines but the number of people afflicted increases, the prevention program is also deemed to be a failure. A declining incidence rate, along with a declining number of those diagnosed with a cancer, indicates success in the prevention of that cancer. 4
As for assessing the treatment side of the NCI program, the criteria used were the mortality rate and the numbers of Americans who died from a cancer. A constant or increasing mortality rate of a cancer over time, along with increased numbers of deaths from that cancer, indicates a failure of the NCI program in the treatment of that cancer. If the mortality rate declines over time but the number of deaths increases, the program for the treatment of that
cancer is also shown to be a failure. If the mortality rate declines and the number of deaths also decline, this indicates success in the treatment of a cancer.
The assessment is based on a long time period (1975–2007), which provides results that are more comprehensive and, thus, more reliable than those based on shorter time periods.
Cancer of the Oral Cavity and Pharynx (Invasive)
The incidence rate of oral and pharyngeal cancer declined over the analysis period, from 13 in 1975 to 10.6 in 2007. With regard to gender, the incidence rate of the males was 21 in 1975 while that of the females was 7; by 2007, the rate for the males had fallen to 16 and for the females to 6. However, the number of Americans afflicted by oral cancer rose from 28,503 in 1975 to 31,861 in 2007. The total number of Americans afflicted with this cancer during 1975–2007 summed to 1 million.
The overall mortality rate of this cancer declined from 4 in 1975 to 2.5 in 2007. With regard to gender, the mortality rate of the males in 1975 was 6.9, while that of the females was 2.3. By 2007, the rate of the males had declined to 3.9 while that of the females had decreased to 1.4. The number of Americans who died from oral cancer decreased over time, from 9287 in 1975 to 7603 in 2007.
Cancer of the Ovary (Invasive)
The overall incidence rate of ovarian cancer declined over time, from 16 in 1975 to 13 in 2007. However, in 1975, the incidence rate of the “65 plus” age group of women was 49 – an incredible 308% greater than the rate of the “under 65” age group (at 12). The incidence rate of both groups declined slightly over time, and by 2007 the rate of the older women was 46 vs. 8 for the younger women. However, the number of women afflicted by ovarian cancer increased from 35,247 in 1975 to 39,132 in 2007. During 1975–2007, a total of 1.3 million women were diagnosed with ovarian cancer.
The overall mortality rate of ovarian cancer declined from 9.8 in 1975 to 8.2 in 2007 (Chart 1). Nevertheless, the mortality rate of the older women in 1975 was 37.6, much greater than that of the younger women at 5.8. By 2007, the rate of the older group had risen to 42.9, a stunning 1341% higher than the 3.2 of the younger group. This indicates that the greatest number of women who died from ovarian cancer were over 65 years of age.
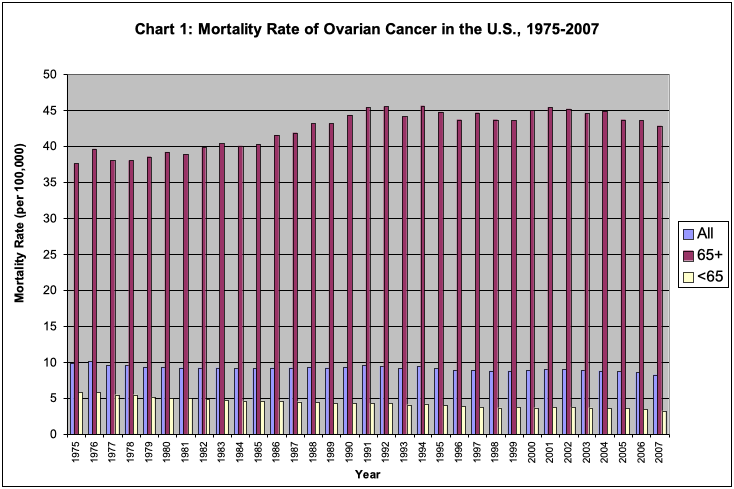
The number of women who lost their lives to ovarian cancer increased from 21,252 in 1975 to 24,801 in 2007. The number of women who died from ovarian cancer during 1975–2007 totaled 770,398. The ratio of deaths to those afflicted indicates that on average, 61% of the women diagnosed with this cancer die from it – a dismal statistic.
Cancer of the Pancreas (Invasive)
The overall incidence rate of pancreatic cancer increased over 1975–2007, from 11.8 to 12.4. The incidence rate of males was 15.6 in 1975, and for the females, it was 9. By 2007, the rate of the males declined to 14, while that of the females increased to 11.
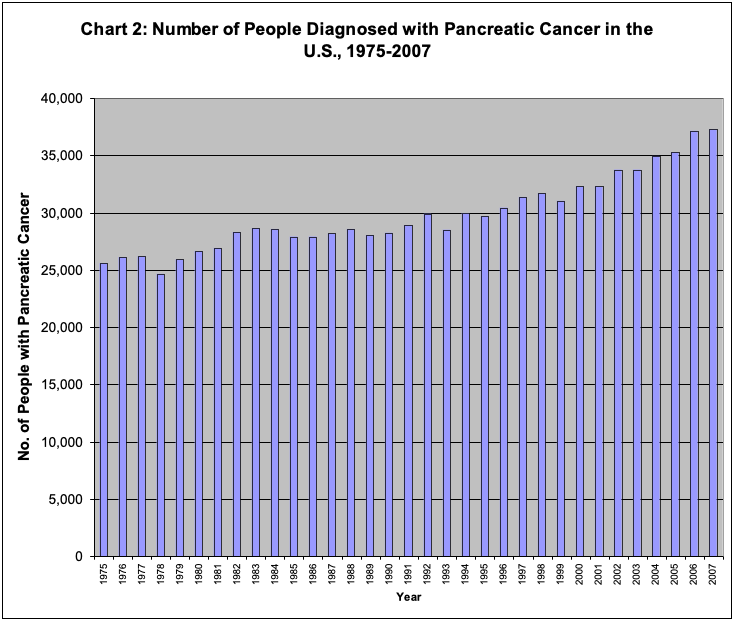
The number of Americans afflicted by pancreatic cancer also increased significantly over time, from 25,571 in 1975 to 37,292 in 2007 (Chart 2).The total number of Americans afflicted with this cancer during 1975–2007 totaled 984,698.
The overall mortality rate of pancreatic cancer remained essentially the same at 10.7 in 1975 and 10.8 in 2007. That constant mortality rate was the result of the men’s rate declining and the women’s rate rising. The males had a mortality rate of 14 in 1975, vs. 8 for the females; in 2007, the rate of the men was 12, as compared with that of the women at 9.
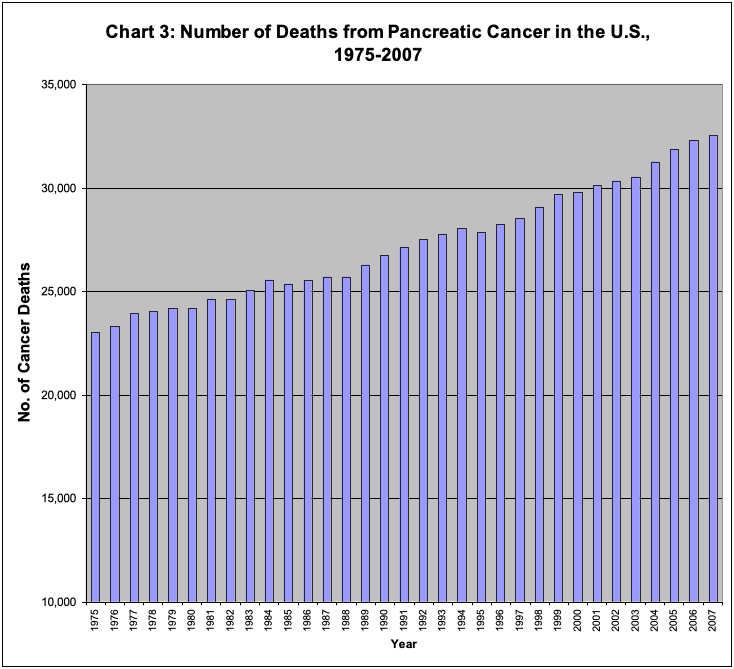
The number of Americans who lost their lives to pancreatic cancer increased over time, from 23,023 in 1975 to 32,525 in 2007 (Chart 3). The total number of Americans who died from pancreatic cancer during 1975–2007 was 899,943. This indicates that on average, 91% of the pancreatic cancer patients die from their cancer – a very bleak outcome.
Cancer of the Prostate (Invasive)
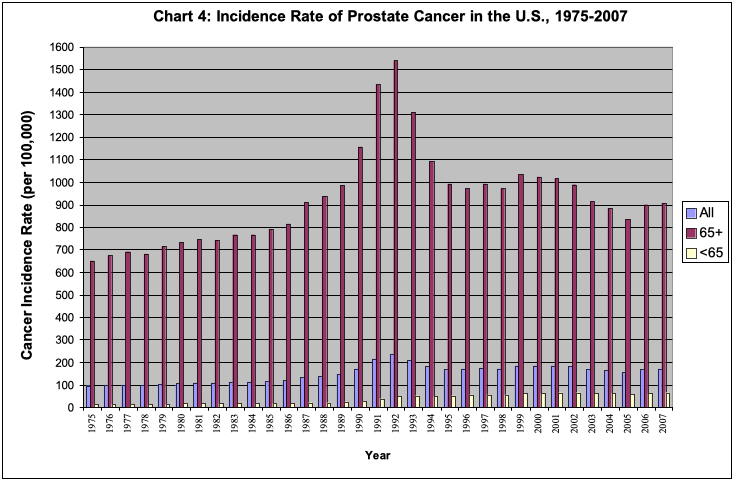
The overall incidence rate of prostate cancer rose rapidly from 94 in 1975 to 171 in 2007 (Chart 4). Moreover, in 1975, the incidence rate of the “65 plus” age group was 650, 4543% higher than the rate of the “under 65” group at 14. By 2007, the rate of the older group had risen to 906, while that of the younger group increased to 65. The incidence rate of the 65-plus group spiked in the early 1990s, then it declined; however, in 2007 the rate was still much higher than in 1975. 5
The number of men diagnosed with prostate cancer in 1975 was 203,058, and it jumped 82% to 515,569 by 2007. The total number of men diagnosed with this cancer during 1975–2007 was an unprecedented 13.5 million – the highest number observed of all the cancers.
The overall mortality rate of prostate cancer decreased from 31 in 1975 to 23.5 in 2007. The mortality rate of the “65-plus” age group was 227 in 1975 while the rate of the “under 65” group was 2.5. By 2007 the rate of both groups declined; the older group’s rate was 174, still tremendously higher than the younger group’s rate (at 1.8).
In 1975, 66,887 men died from prostate cancer, and by 2007 that number had risen to 70,903. The total number of deaths from prostate cancer during 1975–2007 totaled an astonishing 2.8 million. This indicates that, on average, 21% of the men diagnosed with this cancer die from it.
Cancer of the Stomach (Invasive)
The overall incidence rate of stomach cancer decreased over time, from 11.7 in 1975 to 7 in 2007. However, the rate of the males in 1975 (at 17.1) was considerably higher than that of the females (at 7.9). By 2007, the incidence rate of both genders had declined, with the rate of the males at 10.2 and that of the females at 4.8.
The numbers of Americans afflicted by stomach cancer declined from 25,226 in 1975 to 21,512 in 2007. The total number of Americans afflicted with this cancer during 1975–2007 was 794,935.
The overall mortality rate of stomach cancer also declined, from 8.5 in 1975 to 3.6 in 2007. Again, the mortality rate of males was significantly higher (at 12.3) in 1975 than that of females (at 5.9). In 2007, the rates had dropped to 5 for the males and 2.6 for the females.
The number of Americans who died from stomach cancer decreased over time, from 18,379 in 1975 to 10,892 in 2007. The number of people who died from this cancer during 1975–2007 totaled 481,716. On average, 61% of people diagnosed with this cancer died from it – a dismal statistic.
Cancer of the Testis (Invasive)
The overall incidence rate of testicular cancer increased over time, from 3.7 in 1975 to 5.9 in 2007. This rise was affected by increases in the incidence rate of the “under 50” age group, while the rate of the “50 plus” age group stayed essentially around 2. Moreover, the incidence rate of the younger men rose faster than that of the older men over time. Those phenomena are highly unusual, since in other types of cancers examined, the incidence rate of the older age group was typically much higher than the rate of the younger group, and increased faster over time.
The number of men afflicted with testicular cancer more than doubled from 8056 in 1975 to 17,861 in 2007. The total number of men afflicted with testicular cancer during 1975–2007 was 423,840.
The overall mortality rate of testicular cancer was relatively low. In 1975, it was 0.7 and declined to 0.2 by 2007. The mortality rates of both age groups were similar and declined over time. The number of deaths from testicular cancer also declined from 1598 in 1975 to 664 in 2007. The total number of men who died from testicular cancer during the analysis period was 28,520.
Cancer of the Thyroid (Invasive)
The overall incidence rate of thyroid cancer increased 150% over 1975–2007, from 4.9 in 1975 to 12.2 in 2007 (Chart 5). This increase was primarily driven by the females, since their incidence rate jumped from 6.5 in 1975 to 18.5 in 2007, as compared with the males, whose incidence rate was 3.1 in 1975 and 5.9 in 2007.
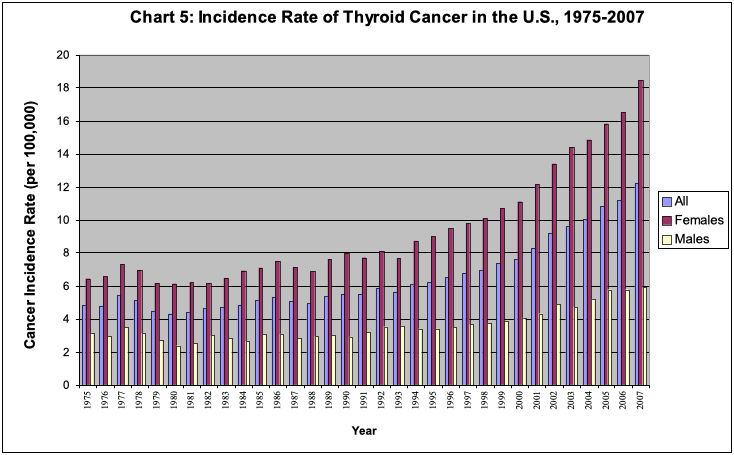
The number of Americans afflicted by invasive thyroid cancer more than tripled over time, from 10,475 in 1975 to 36,900 in 2007. The number of Americans diagnosed with this cancer during this time period totaled 567,612.
The mortality rate of thyroid cancer was relatively low in 1975, at 0.55 (per 100,000) and it declined to 0.49 in 2007. By contrast to other cancers, the mortality rate of females was higher (0.69) in 1975 as compared with the rate of the males (0.39). Over time, the gap between the genders narrowed, so that by 2007 the rate of the males was 0.51 while that of the females was 0.48. Also, the number of Americans who died from thyroid cancer rose over time, from 1188 in 1975 to 1478 in 2007. A total of 39,937 Americans died from this cancer during 1975–2007. This indicates that on average, 7% of the people diagnosed with thyroid cancer die from it.
Conclusions
Part 1 and Part 2 of this study evaluated 17 out of 24 cancers over 1975–2007 in alphabetical order – from bladder cancer to non-Hodgkin’s lymphoma – published in previous issues of the Townsend Letter. Part 3 analyzes the remaining seven cancers during the same time period: oral cavity and pharynx, ovary, pancreas, prostate, stomach, testis, and thyroid.
Prevention
The analysis in Part 3 found a failing US/NCI program in the prevention of 6 of the 7 cancers, as indicated by increasing (or constant) incidence rates and increasing numbers of people diagnosed with a specific cancer, or decreasing incidence rates but increasing numbers of those afflicted. These cancers are: oral cavity, ovary, pancreas, prostate, testis, and thyroid. Only 1 of the 7 cancers had declining incidence rates and declining numbers of those afflicted, showing success in the prevention side. That cancer is stomach cancer.
With respect to gender, as seen in our previous studies, the incidence rates of males were significantly higher than those of the females, and increased faster over time. This is observed for the following cancers: oral cavity and stomach. However, in pancreatic cancer, the incidence rate of women increased 20% over the analysis period, while that of men decreased 10%. One would think that the prevention program for pancreatic cancer – if there was one – would affect both genders equally. Was there something that made women more vulnerable to getting pancreatic cancer over the period of analysis? This could be a topic for future research. Also, in thyroid cancer, the females had a higher incidence rate than the males and it increased faster over time.
With respect to age, in both ovarian and prostate cancers, the older age groups had astonishingly higher incidence rates than the younger age groups. One explanation for this is their cumulative exposure to environmental carcinogens over a longer time span than the younger age groups. Consequently, they are much more likely to contract cancer as their immune systems have been weakened by the attacks of the carcinogens (chemicals, radiation, and other environmental toxins). Testicular cancer, however, showed the opposite age pattern: the younger men had a higher incidence rate than the older men.
Treatment
The analysis in Part 3 finds a failing US/NCI program in the treatment of 4 out of 7 cancers as indicated by rising or constant mortality rates and rising numbers of deaths, or declining mortality rates and rising numbers of deaths. These cancers are: ovary, pancreas, prostate, and thyroid.
There were 3 of 7 cancers that had decreasing mortality rates and declining numbers of deaths, suggesting that the US cancer program had success in the treatment of these cancers. These cancers are: oral cavity, stomach, and testis.
With regard to gender, mortality rates of males were greater than those of females for oral cavity, pancreatic, and stomach cancers. In pancreatic cancer, however, it is puzzling that the mortality rate of women rose 12% while that of men declined 9% over the same time period. One would think that the treatment program for pancreatic cancer would affect both genders in the same way.
With regard to age, in both ovarian and prostate cancers, the older age groups had tremendously higher mortality rates, and these rates increased faster than those of the younger age groups. These statistics show that the US/NCI (and FDA) cancer program has especially failed the older age group. One exception to the age affect is that testicular cancer did not show an age difference in mortality rates.
Summary
The final analysis (of Parts 1–3) showed unquestionably that during 1975–2007, the US/NCI program failed in the prevention of 22 of the 24 cancers studied: bladder, brain, female breast cancer in situ, female breast invasive, colon, corpus/uterus, esophagus, Hodgkin’s lymphoma, kidney, leukemia, liver, lung, melanoma, mesothelioma, myeloma, non-Hodgkin’s lymphoma, oral cavity, ovary, pancreas, prostate, testis, and thyroid. Only 2 of the 24 cancers showed success on the prevention side: cervical and stomach cancer. The highest numbers of cancer cases during this time period were from prostate cancer at 13 million, followed by female breast invasive cancer at 10.6 million, and lung cancer at 5.4 million. The lowest number of cancer cases was from mesothelioma at 84,000. A stunning total of 52.3 million Americans were diagnosed with cancer during 1975–2007.
In addition, the final analysis also revealed that during 1975–2007, the US/NCI program failed in the treatment side of 16 out of 22 cancers: bladder, brain, female breast invasive, corpus/uterus, esophagus, kidney, liver, lung, melanoma, myeloma, non-Hodgkin’s lymphoma, leukemia, ovary, pancreas, prostate, and thyroid. 6 Only 6 out of 22 cancers had success on the treatment side: cervical, colon, Hodgkin’s lymphoma, oral cavity, stomach, and testis. The highest number of deaths were caused by lung cancer at 4.6 million, followed by prostate cancer at 2.8 million, and female breast cancer (invasive) at 2.5 million. The lowest number of deaths came from testicular cancer at 29,000. A marked total of 18.6 million Americans died from cancer during 1975–2007.
Final Thoughts
The results of our analysis give rise to this question: Why did the US/NCI program fail in preventing and in treating various cancers during 1975–2007? With regard to the failure of the program in cancer prevention, we discovered that the US/NCI does not have a cancer prevention program.
A national cancer prevention program requires two components: the discovery of carcinogens through research, and regulatory power to control/ban these carcinogens. The NCI carries out research on carcinogens, but that is not enough. Its failure in prevention is evidently linked to the fact that it does not have the authority to regulate or ban carcinogens. In addition, it does not disseminate cancer-prevention information in a proactive/well-publicized manner directly to the public. For example, if the NCI discovers that a pesticide used by farmers is carcinogenic, it does not have the authority to ban the substance; it also unfortunately does not notify farmers so that they may stop using it. Such a system is designed to fail.
The analysis of cancer mortality in our study showed that the US/NCI program also failed in cancer treatment during 1975–2007. Since conventional methods of treatment – surgery, radiation, and chemotherapy – have not worked for many cancers, it is obvious that the treatment program should include alternative methods. However, alternative treatments faced many obstacles during 1975–2007 from the federal or state governments, including persecution of practitioners of alternative treatments by the FDA and state medical societies, as described in Politics in Healing by D. Haley. Thus, a major obstacle to treating cancer successfully in the US is the fact that Americans do not have the freedom to choose their treatment for cancer. In addition, the health insurance companies do not pay for alternative treatments to cancer, limiting the choices even further for the cancer patient.
Given the grand failure of conventional cancer treatment used by the US/NCI program, we recommend that the FDA not have regulatory authority over cancer drugs or treatment. The millions of cancer patients desperate to survive this disease should be able to choose the health-care provider and mode of treatment for their cancer, without governmental constraints. Americans should not have to flee to other countries to receive their treatment of choice. That is a national disgrace and it is astonishing that this form of tyranny has been allowed to exist for all these years.
The grand failures on both the prevention and treatment sides call for a basic restructuring of the US/NCI cancer program. On the prevention side, the changes should include the creation of an agency that has both research capabilities and authority to regulate/ban carcinogens. The cancer program should also disseminate the information directly to the public. On the treatment side, Americans with cancer should have the freedom to choose whichever treatment they wish. Also, alternative treatments for cancer should be tested/supported by the government. The FDA should not have regulatory authority over cancer therapies. In addition, there should be a restructuring of the health insurance industry.
Ultimately, the solution lies with the American citizens. We must take responsibility for our own health, by educating ourselves, informing our politicians of the shortcomings of the existing cancer program, and demanding better prevention and treatment programs. Until that happens, Americans will remain victims of an antiquated and incompetent US/NCI cancer program.
Notes
1. Apostolides AD, Apostolides IK. The US Cancer Program and Specific Types of Cancers, 1975–2007: A Failure. Townsend Lett. Aug/Sept 2011; Part 1; Oct 2011; Part 2.
2. The incidence rate is expressed per 100,000 population. Thus, it accounts for increases in the population of the country. If the population doubles and the number of cases of a given cancer also double, the incidence rate will stay the same. Consequently, an increase in the incidence rate indicates a real increase in cancer cases/cancer impact. The same applies to the mortality rate.
3. For each cancer, during the analysis period (1975–2007), we calculated the following charts: (1) The incidence rate – to include overall rates, and rates for males and females, or of age groups for cancers of the same gender – as relevant; (2) the number of Americans afflicted with the cancer; (3) the mortality rate – to include overall rates, and rates for males and females, or of age groups for cancers of the same gender – as relevant; and (4) the number of Americans who died from that cancer.
4. The number of Americans afflicted by a cancer is derived by multiplying the incidence rate by the ratio of the population of the US in that year per 100,000. The result of this calculation shows the impact of a cancer on the changing/increasing population of the US. Therefore, it provides a more comprehensive perspective than the incidence rate. The same applies to the mortality rate and the number of deaths.
5. The spiking observed in Chart 4 during 1991–1992 was due to PSA testing, which increased the counts, according to communication with NCI staff.
6. Mortality data were not available for 2 of the 24 cancers (mesothelioma and female breast cancer in situ).
References
Fagin D, Lavelle M., Center for Public Integrity. Toxic Deception – How the Chemical Industry Manipulates Science, Bends the Law and Endangers Your Health. Monroe, ME: Common Courage Press; 1999.
Faquet GB. The War on Cancer: An Anatomy of Failure, A Blueprint for the Future. Dordrecht, Netherlands: Springer; 2005.
Gofman, JW. Radiation and Human Health: A Comprehensive Investigation of the Evidence Relating Low-Level Radiation to Cancer and Other Diseases. San Francisco: Sierra Club Books; 1981.
Gould JM et al. The Enemy Within – The High Cost of Living Near Nuclear Reactors. New York: Four Walls Eight Windows; 1996.
Hailey D. Politics in Healing – The Suppression and Manipulation of American Medicine. Washington, D.C.: Potomac Valley Press; 2005.
Markowitz G, Rosner D. Deceit and Denial – The Deadly Politics of Industrial Pollution. Berkeley, CA: University of California Press; 2003.
Nader R, Abbotts J. The Menace of Atomic Energy. New York: W. W. Norton and Co.; 1977.
National Research Council, Board of Radiation Effects Research. Health Risks from Exposure to Low Levels of Ionizing Radiation – BEIR VII PHASE 2. Washington, D.C.: National Academies Press; 2006.
SEER-9 (Surveillance Epidemiology and End Results). Cancer statistics review 1975–2007 [online document]. Available at: www.seer.cancer.gov/statistics.
Sherman JD. Life’s Delicate Balance – Causes and Prevention of Breast Cancer. New York: Taylor & Francis; 2000.
United States Bureau of the Census. Population. In: Statistical Abstract of the United States.
Yablokov AV, Nesterenko VB, Nesterenko AV, Sherman JD consulting editor. Chernobyl – Consequences of the Catastrophe for People and the Environment. Reprint of volume originally published by the New York Academy of Science in 2009.
Anthony D. Apostolides, PhD, received a doctoral degree in economics from the University of Oxford, UK, and an MA degree from the University of Pittsburgh. He has taught on health-care economics and related fields at the university level, and carried out research in health-care economics and delivery. He was engaged in research at the UN, Economic Commission for Europe and The Conference Board. He also worked for the State of Maryland Department of Health, and for the federal government. His publications include articles in peer-reviewed journals.
Ipatia K. Apostolides, BA, has a bachelor’s degree in biology from Case Western Reserve University and several years’ graduate coursework. She has worked in the cancer field for over 15 years – as a laboratory manager and data manager at the Cleveland Clinic, and as data manager at the Children’s Hospital Bone Marrow Transplant Center in Cincinnati. She was also supervisor in the PLCO study at Georgetown University. She has coauthored several medical articles related to cancer.








0 Comments